.png)
Update 3/31/2022.
Please note that the occupation group methodology noted below is no longer used to create the remote occupation groups in JobsEQ which are noted as being “Rarely Remote”, “Occasionally Remote”, or “Frequently Remote”. Chmura now relies on our RTI (Real Time Intelligence) job posting data set to determine which occupations are more likely to be remote.
Knowing which occupations can be performed remotely—that is, by working from home—is valuable for understanding the future of labor force supply in the post-COVID economy.
Working from home was already becoming more common, but the COVID-19 crisis forced many employers to quickly and drastically alter policies to enable more workers to perform their jobs from home. This “forced experimentation” with remote work may open some employers eyes to the benefits of an increasingly remote workforce. Shopify, for example, announced in May that its 5,000 employees would be allowed to work from home indefinitely. More employers following this example could induce a stark and fundamental shift in the nature of work.
Occupation Analysis
To begin exploring the ramifications of these potential changes, a first step is to understand which occupations are more suitable for working from home. Unfortunately, the bulk of the data available for this analysis is pre-COVID. The coronavirus lockdown radically changed operating requirements for jobs regarding what is considered acceptable. Teaching K-12, for example, was predominantly considered something that needed to be done on site; with COVID-19, however, many school systems adapted and moved to remote learning arrangements. Nevertheless, even if our occupation characteristics data are coming from the pre-COVID world, this information will give us a solid baseline for further analysis.
To define which occupations can be performed remotely,[1] we leveraged two data sets: the American Time-Use Survey and the Department of Labor’s O*NET. The Time-Use Survey asks if respondents can work from home, if they actually have worked from home, and the reasons for working from home. Using the available responses, we were able to exclude cases where someone, for example, occasionally takes additional work home when they get behind and to focus on those instances where someone more regularly performs work from their home. Specifically, we focused on identifying individuals that actually do work from home (rather than those who say they can work from home but don’t) and especially those who often work from home.[2]
To supplement these data—both for validation purposes as well as obtaining data for occupations with insufficient sample sizes in the survey data—we used information from O*NET, a compendium of data on worker characteristics. Specifically, O*NET contains information on the extent that workers “…perform job tasks in close physical proximity to other people.” In addition, O*NET has information on other working conditions that would typically preclude working from home, such as working outdoors or in an enclosed vehicle or needing to spend working time standing or wearing safety equipment. In all, we used 21 characteristics from the O*NET data to assist in defining which occupations can or cannot be performed from home based upon the nature of the job.
Combining the Time-Use Survey and O*NET data, we classified all occupations[3] into one of three buckets: remote jobs, partial-remote jobs, and non-remote jobs. (See the link at the bottom of this blog for the full list of occupations and classifications. These categories will also be available soon for regional analysis within JobsEQ.) The above table shows the ten largest occupations (by employment) in each of these groupings. About 12% of all U.S. employment falls under remote job occupations with 26% in the partial-remote bucket and the remaining 62% in non-remote occupations.
These classifications are for the occupations on average; not every single job that falls within an occupation will necessarily be the same. For example, while software developers are categorized as a remote occupation, this does not imply that every single software developer position can be performed fully remotely; rather, this designation means that, on average, software developer jobs can be performed remotely. The same can be said for the partial- and non-remote designations. Not every job will strictly fall in line with the overall occupation category designation.
Furthermore, to reiterate, these designations are based upon pre-COVID conditions. As we gather more data on the post-COVID workplace, we will certainly revisit these categorizations as we expect shifts to occur in the range of typical work environments for many of these occupations.
Industry and Regional Analysis
Changing remote work conditions have significant implications for economic development, site selection, and urban planning. Employers shifting to remote work arrangements can drastically change the demand for office space. Likewise, labor supply questions for some occupations need to be approached differently if commute-to-work time is no longer as important a limiting factor. If more people are working from home, shifts in daytime population will have ripple effects for both business districts and neighborhoods.
The above table contains the industries (defined at the 4-digit NAICS level) which contain the highest concentrations of remote-work employment as defined by each industry’s component occupations. The software developers industry at the top of the list, for example, is estimated to contain 81% remote employment.[4] Many of the industries on this list are traditional “office-space” employers—that is, operations that are performed in an office rather than in an industrial, warehouse, retail space, or other non-office location.
Despite the typical work characteristics of occupations being in a state of flux following the coronavirus disruption, the industry analysis above can be a helpful baseline for comparing communities. By examining the industry mix of every metropolitan area, for example, we can quantify the mix of remote work jobs by region. This would be helpful for identifying the regions that could be most impacted by further shifts of work-from-home arrangements becoming more commonplace—meaning the traditional office space demand could decline in kind along with such a shift.
-
Remote Work Index
-
66 to 77
-
77 to 89
-
89 to 100
-
100 to 115
-
115 to 130
-
130 to 145
The map above displays all the metropolitan statistical areas (MSAs) in the United States by a Remote Work Index. The index compares the mix of remote-work employment in the region versus the average in the nation.[5] An index of 100% means the region has the exact same mix as the nation. An index of 110% means the region has 10% more remote jobs than average for a region of its size and an index of 90% means the region has 10% less remote jobs than average for a region of its size.
The metro areas with the most or least remote work employment follow several patterns. Of those with higher ratios of remote work jobs, some have high concentrations of tech or office employment (such as San Jose, Boulder, and Washington D.C.) while others have high concentrations of postsecondary employment[6] (Ithaca and Ann Arbor).
Several patterns are prominent among the metros with less remote work employment as well. Of metro areas with lower ratios of remote work jobs, some have high concentrations of tourism industries (such as Myrtle Beach, Kahului, and Ocean City), others are heavy with agriculture (Madera and Visalia), while others have large manufacturing sectors (Elkhart and Morristown).
Implications
Some of the significant impacts of remote work may unfold as the economy settles into its post-COVID phase. This is speculative, of course, and depends upon how strongly employers embrace expanded remote work for their employees. We also may see additional variation by industry develop beyond what the baseline data above suggest.
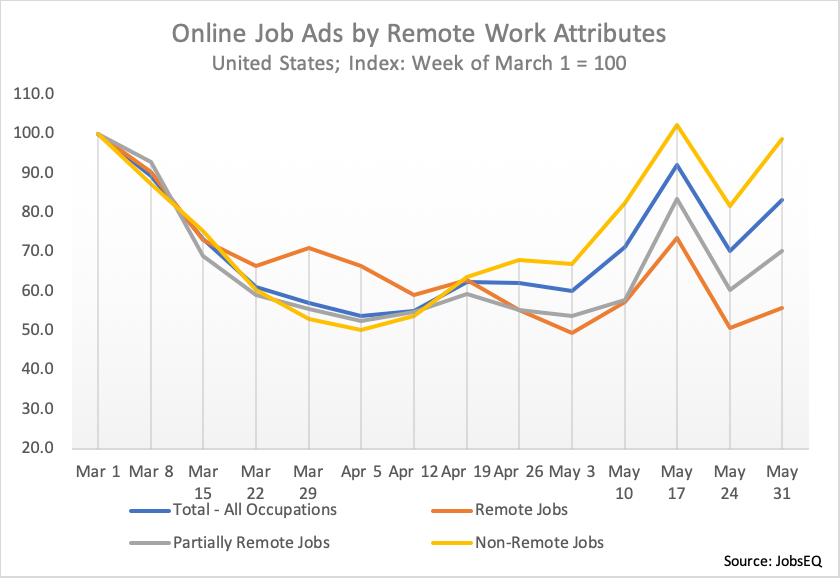
Nevertheless, already we can see clear differentiation in the data for remote work jobs compared to non-remote jobs. Online job ads plummeted during the coronavirus shutdown in March and April 2020. As reported in our May 22 blog and shown in the chart above,[7] the set of remote work occupations generally fared better than average during the first six weeks of the slowdown. While new job ads declined for nearly all occupations, ads didn’t decline as much for this group of remote work occupations. However, the script flipped in the weeks of mid-April and early May. As states moved closer to opening up, ads for non-remote jobs began to rebound while remote-work occupations failed to get traction, skidding even further in some weeks.
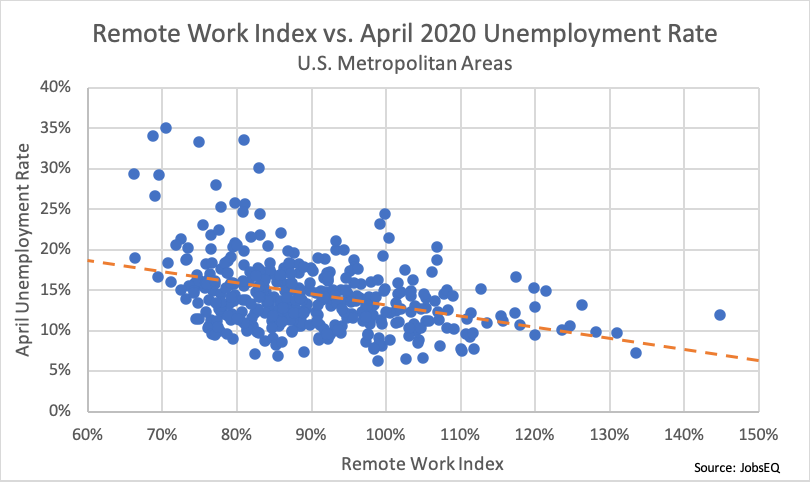
We can also observe a slight relationship between concentrations of remote employment and the economic health of a region. Comparing the Remote Work Index of MSAs to their April 2020 unemployment rates, those regions with higher concentrations of remote jobs tended to have lower unemployment rates (R2 = 0.14).[8] This correlation isn’t too surprising to find at the regional level since at the occupation level many of the remote careers (such as computer and finance occupations) tend to have lower unemployment rates.
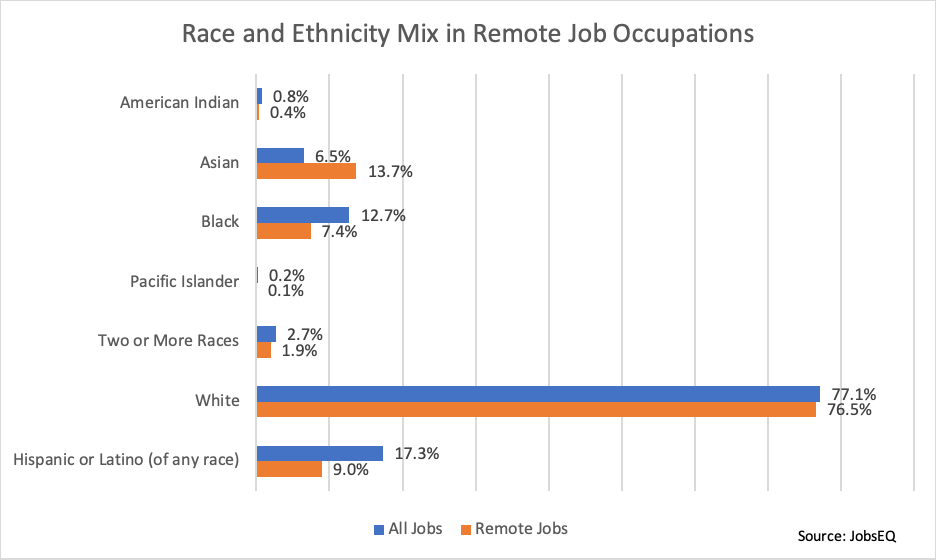
There are also demographic implications, as some demographic groups are not as prevalent in remote work occupations, and therefore not best positioned to take advantage of these jobs. For example, Blacks account for 12.7% of all workers, but just 7.4% of workers within remote work occupations. Hispanic or Latinos are under-represented as well, accounting for 17.3% of all workers compared to 9.0% within remote work occupations. Asians, in contrast, make up 6.5% of the workforce overall, but 13.7% of workers in remote work occupations.
A strong pathway to remote jobs is higher education. About 35% of all jobs are estimated to typically require a two-year degree or higher for entry. In contrast, 87% of remote work jobs typically require a two-year degree or higher.[9]
Conclusion
As we grapple with the lasting impact of COVID on the U.S. economy, whether or not occupations can be performed remotely is a helpful differentiator. Over the short-term, there have already been recorded variation in impacts among remote versus non-remote jobs. The long-term effects remain to be seen as the direct COVID impact plays out and the responses of employers formulate and take hold in the post-COVID economy.
Remote Work Data Download
These data are available for download in Excel format:
Terms of Use
Free to use if data are sourced to: Chmura Economics & Analytics, JobsEQ.
[1] For other approaches to defining remote work jobs, see https://fivethirtyeight.com/features/the-americans-who-suffered-when-the-economy-shut-down-are-also-in-more-danger-as-it-reopens/ as well as https://bfi.uchicago.edu/wp-content/uploads/BFI_White-Paper_Dingel_Neiman_3.2020.pdf in addition to https://bfi.uchicago.edu/wp-content/uploads/BFI_WP_202051.pdf.
[2] Sample data were obtained from the 2017 and 2018 American Time Use surveys, consisting of 10,040 useable respondent observations—those that were employed and answered the work from home questions.
[3] Occupations at the 6-digit SOC level, using 2018 hybrid SOC codes.
[4] Specifically, for this analysis, we began with the typical staffing patterns for every industry (per JobsEQ) and added 100% of employment of remote occupations and 50% of partial-remote occupation employment to get the total industry mix of remote employment as it compares to total employment in that industry.
[5] Similar to the industry analysis above, 100% of employment of remote occupations and 50% of partial-remote occupation employment is summed to estimate the total remote employment.
[6] Most post-secondary teachers fall into the partial-remote category, tending to boost the index scores of regions with a heavy college and university presence.
[7] For the May 22 blog, we used an earlier version of our remote-job categories which differs somewhat from the one used and shown in this blog. Nevertheless, despite the definition change, there were no substantial changes in the remote-job online ads analysis—meaning the same trends shown there apply to the revised remote-job definition.
[8] A similar relationship is found when comparing the index value to the average unemployment rates in 2019, though the April 2020 relationship was a tad stronger.
[9] Typical minimum education requirements are determined by detailed-level occupation as defined here: https://www.bls.gov/emp/tables/education-and-training-by-occupation.htm.