.png)
Since the beginning of the COVID-19 pandemic, Chmura has been providing updates on the impact the pandemic has been having on online job posting volume using our JobsEQ RTI data. Following a rapid and sustained drop in volume, recent weeks have shown job posting volume starting to rebound, including a 25% increase in the week starting May 17.[1] In this blog, we take another step in measuring the impact on job ads by comparing the volume observed during the pandemic to the “expected” volume during the same time under normal conditions. In other words, had the pandemic never occurred, what would the job postings volume over the last few months look like, and how much lower is it now because of the pandemic?
Using the full RTI dataset, Chmura developed a model to predict expected volume for each week of 2020 under a scenario where the COVID-19 pandemic never occurred. In addition to allowing us to better measure the impact of the pandemic, using the expected volume allows us to also better measure the recovery – the closer actual volume gets to expected volume, the further along in recovery a region is likely to be.
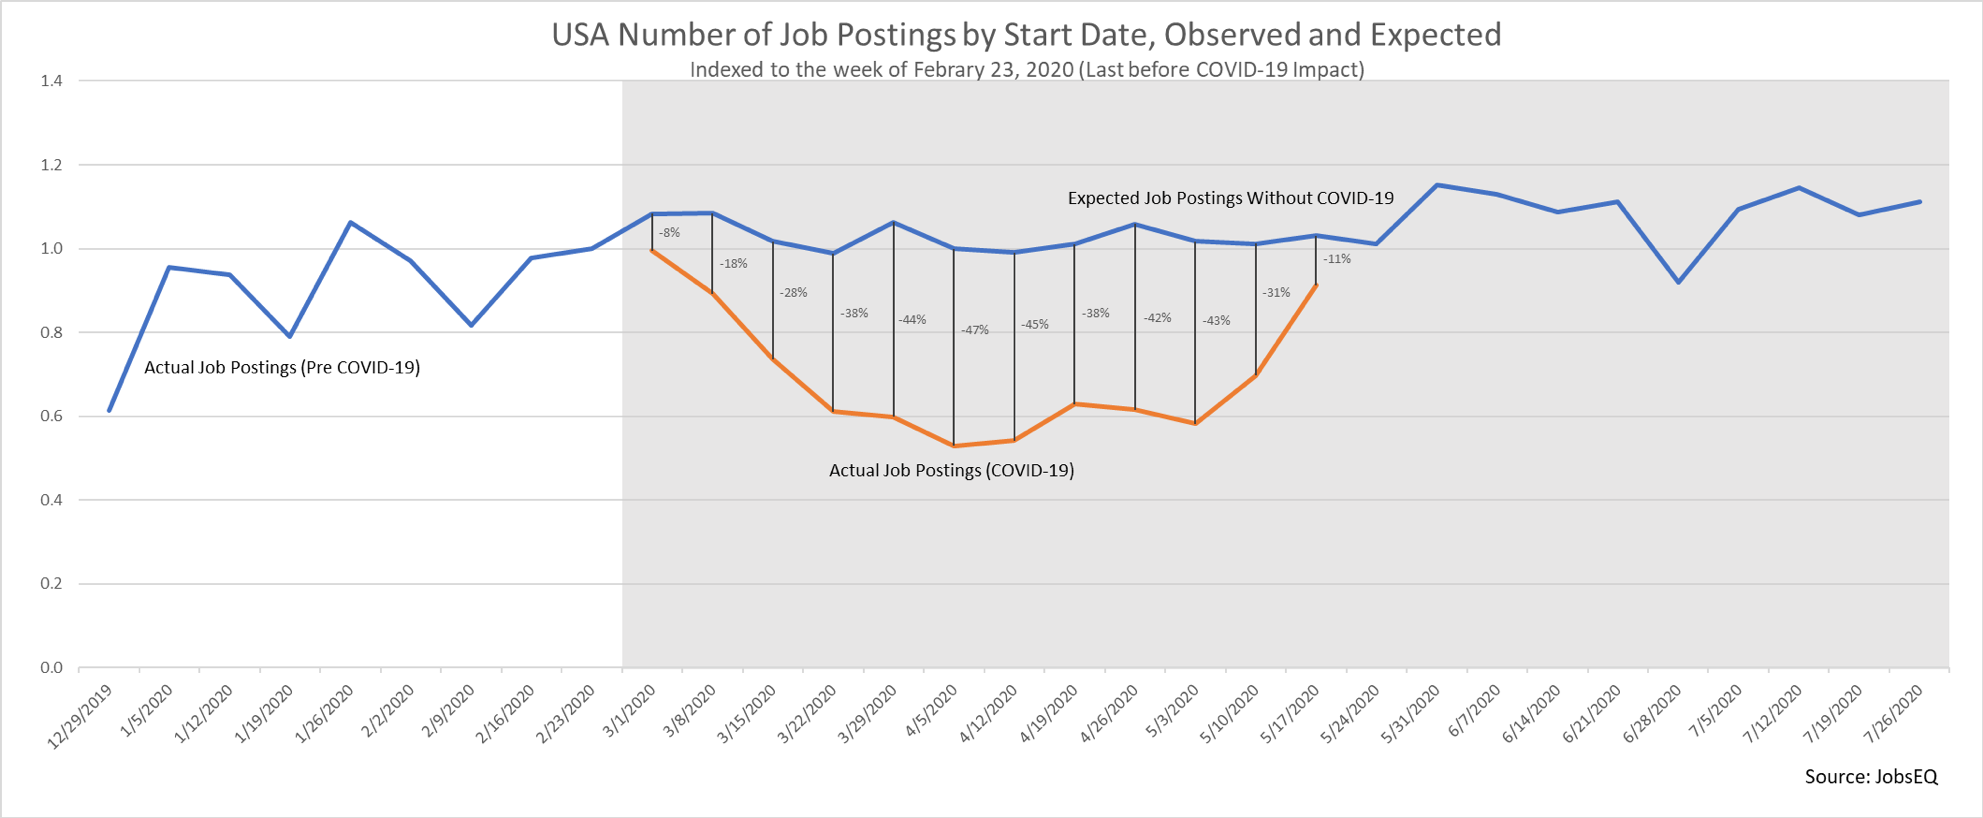
The chart above shows RTI volume in the United States by start date, indexed to the week of February 23, 2020, with the shaded area representing the period of COVID-19 impact. The blue line is the “no-COVID” job posting volume: the blue line outside of the shaded area represents actual volume pre-COVID and the blue line within the shaded area is the expected volume if the COVID crisis did not occur. The orange line represents actual job posting volume during COVID-19. The difference between the blue and orange lines for any week is how much lower actual volume was from expected volume.
In the nation, volume reached a trough of 47% below expected volume during the week of April 5 and was at least 38% below expected for seven straight weeks, from the week of March 22 through the week of May 3, averaging 42% below expected volume during that time. Volume has since begun to rebound, reaching only 11% below expected volume for the week of May 17 and providing evidence the recovery is underway—something that was seen in the recent May jobs report, where employment rose by 2.5 million,[2] much to the surprise of many economists.
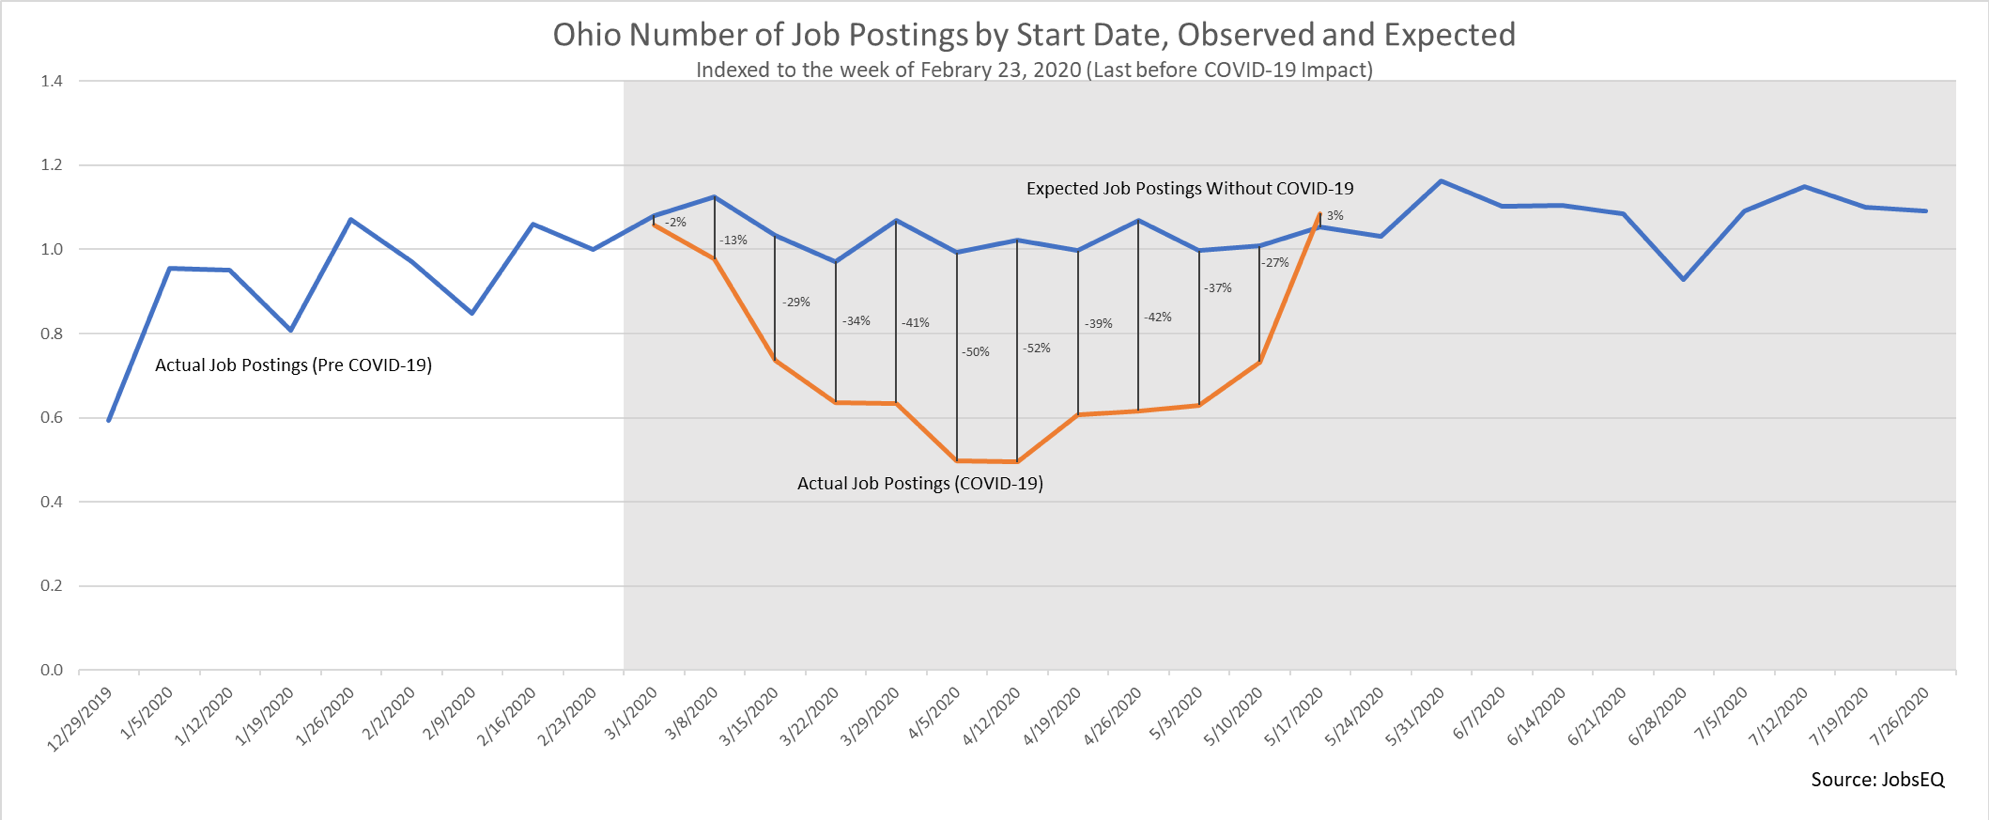
Taking this analysis to the regional level, we can see the extent of the impact for different states. Below we are highlighting two states that followed very different paths with the impact from the pandemic—Ohio and Hawaii. Ohio was one of the first states to implement many of the closures and stay at home orders, doing so before the number of infections reached the levels seen in many other states that issued similar orders. In the last few weeks, Ohio has begun opening most segments of the economy. The rapid closure and relatively early reopening is reflected in the impact on job posting volume in Ohio, where volume reached a low of 52% below expected volume, greater in magnitude than the United States as a whole. Ohio, however, is also experiencing a very rapid rebound in volume, even going slightly above expected volume during the week of May 17.
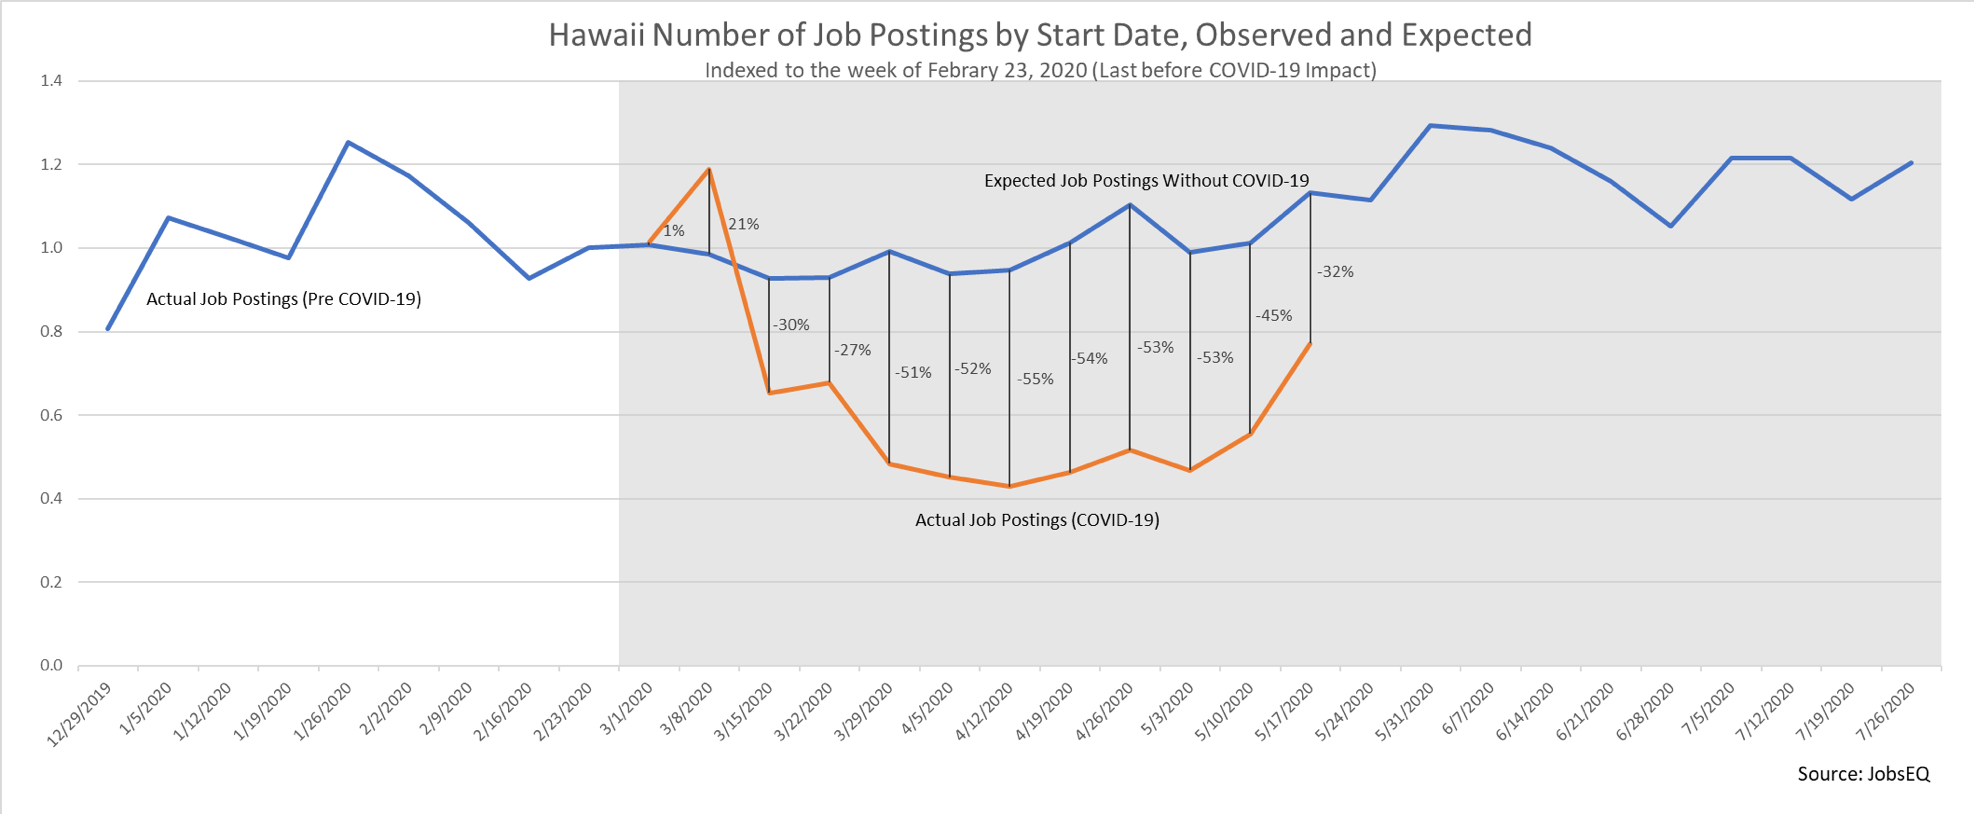
Hawaii was much slower to see an impact, not falling below expected volume until the week of March 15. Its decline was sustained, however, staying below 50% less than expected volume for six straight weeks, and at 32% below expected volume as recent as the week of May 17. This sustained period of low volume occurred because Hawaii’s economy is largely driven by tourism, an industry that has almost completely paused during the pandemic. Hawaii will be an interesting case to follow as the recovery continues, as it typically sees a relatively large increase in volume leading into the summer. Even as volume continues to rise in Hawaii, it will likely remain below its expected volume, compared to most other states, in part, due to the fact some tourists will be cautious to travel by airplane for some time.
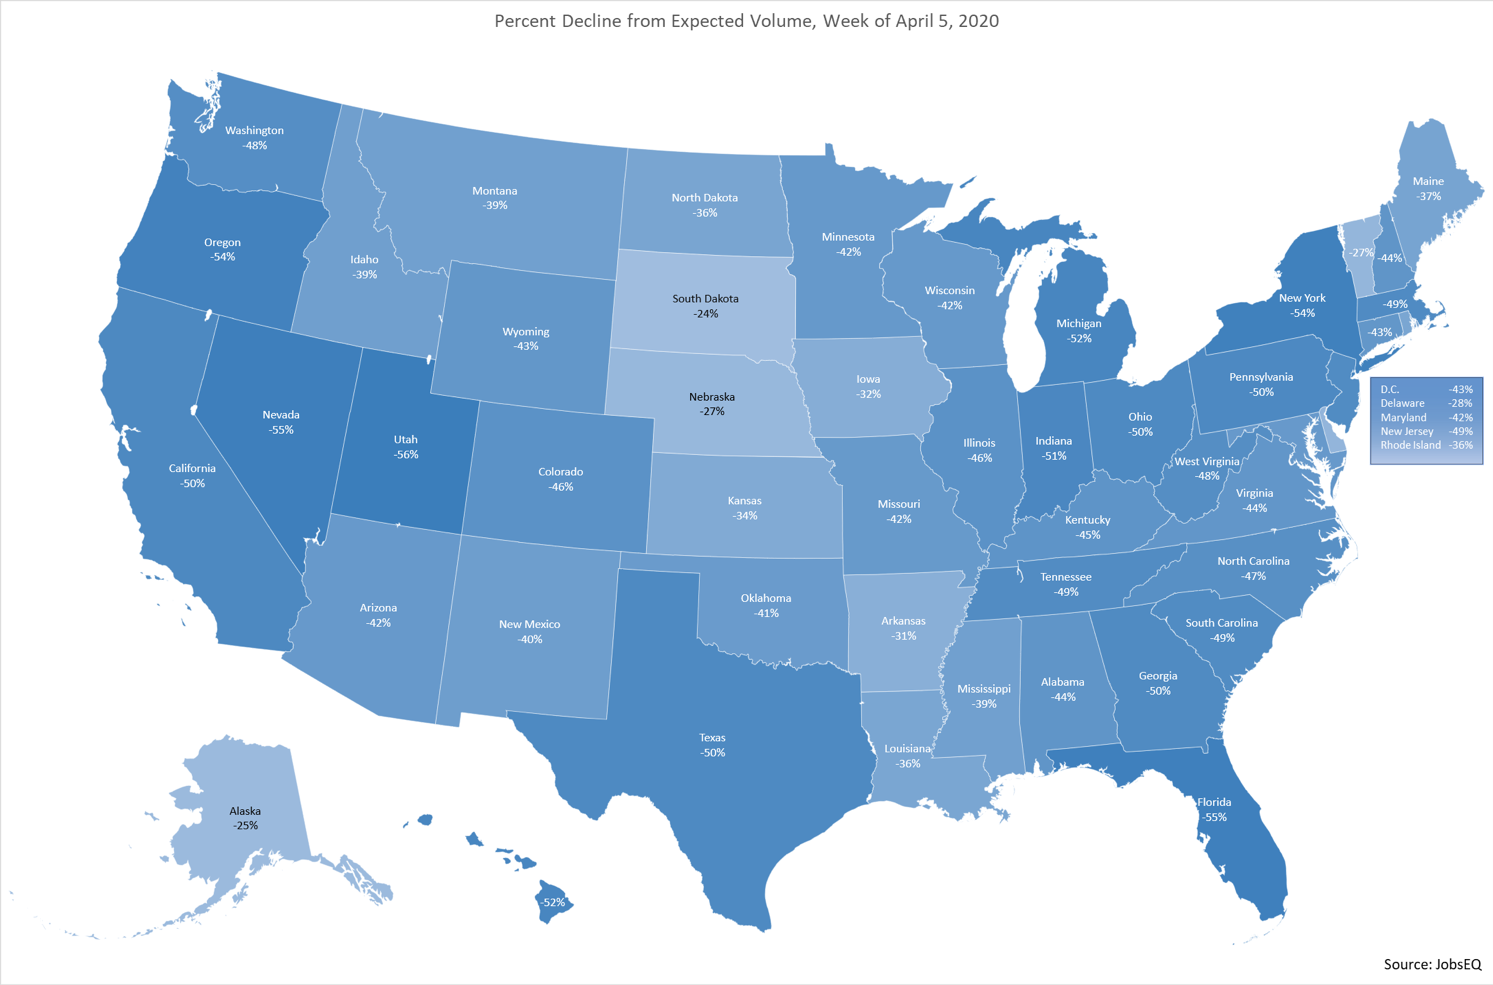
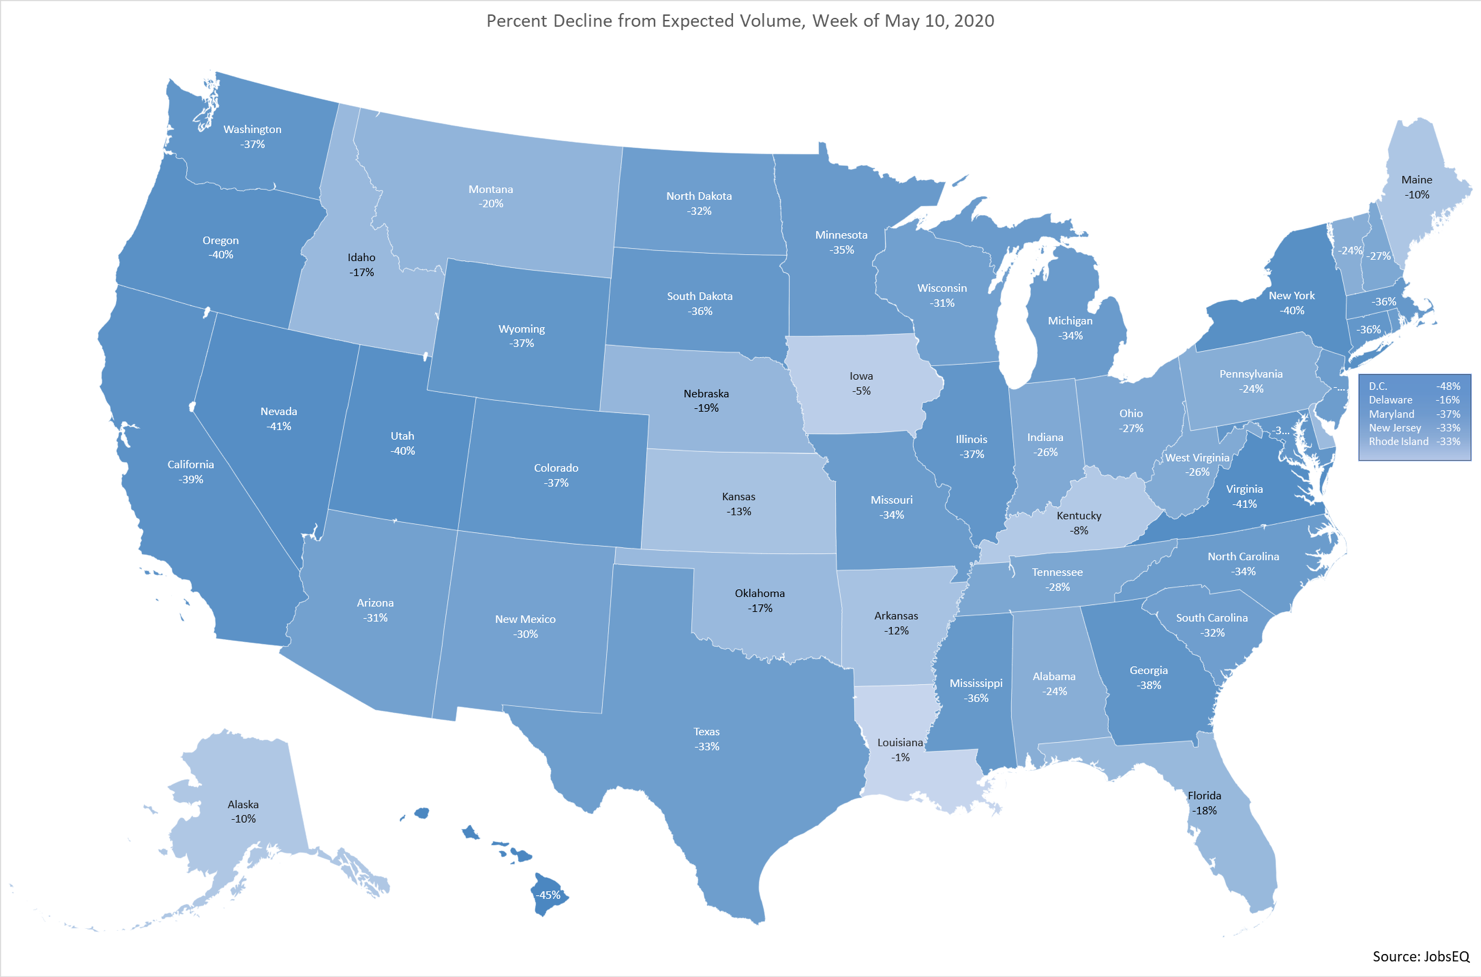
Lastly, the two maps below show the percent decline from expected volume in each state for the weeks of April 5 and May 10, respectively. In almost every state, volume in the week of May 10 is closer to expected volume compared to the week of April 5; only South Dakota and Washington D.C. had lower volume the week of May 10.
Click on each map to view a larger image.
Going forward, we will use observed RTI volume data and expected job posting volume to better measure the impact and the recovery from the COVID-19 pandemic.
Note about expected volume:
The major contributors to changes in job posting volume are seasonal and holiday impacts, where volume may change drastically in the weeks leading up to or immediately following a holiday. Not accounting for the holidays can make it difficult to measure the true magnitude of the impact other variables have on volume. The most extreme example of this can been seen during the weeks around the Christmas holiday, where volume falls and then increases very rapidly. The chart below shows new ad volume during the seven-week span from the 1st week of December through the 3rd week of January for 2018 and 2019, indexed to the 3rd week of December. From the 3rd week of December to the 4th week of December (the week of Christmas) volume fell 46% and 45% in 2018 and 2019, respectively. For both years coming out of the Christmas holiday week, volume increased rapidly, more than doubling by the 2nd week of January.
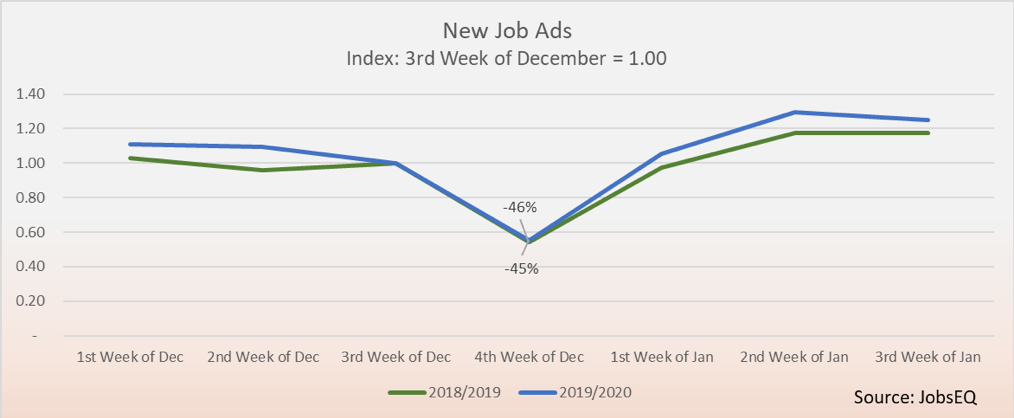
While Christmas is the most extreme example, most weeks in the year follow some seasonality trend; by accounting for these trends we can more accurately measure the impact the COVID-19 pandemic has had on job posting volume.
[1] http://www.chmuraecon.com/blog/2020/may/29/covid-19-job-trends-week-of-may-17-2020/
[2] https://www.bls.gov/news.release/empsit.nr0.htm