.png)
Some people are hesitant to use online job ads data[1] since web ads do not cover all hiring activity. However, as shown below, the volume of these ads is fairly comparable to hiring in most occupation groups.
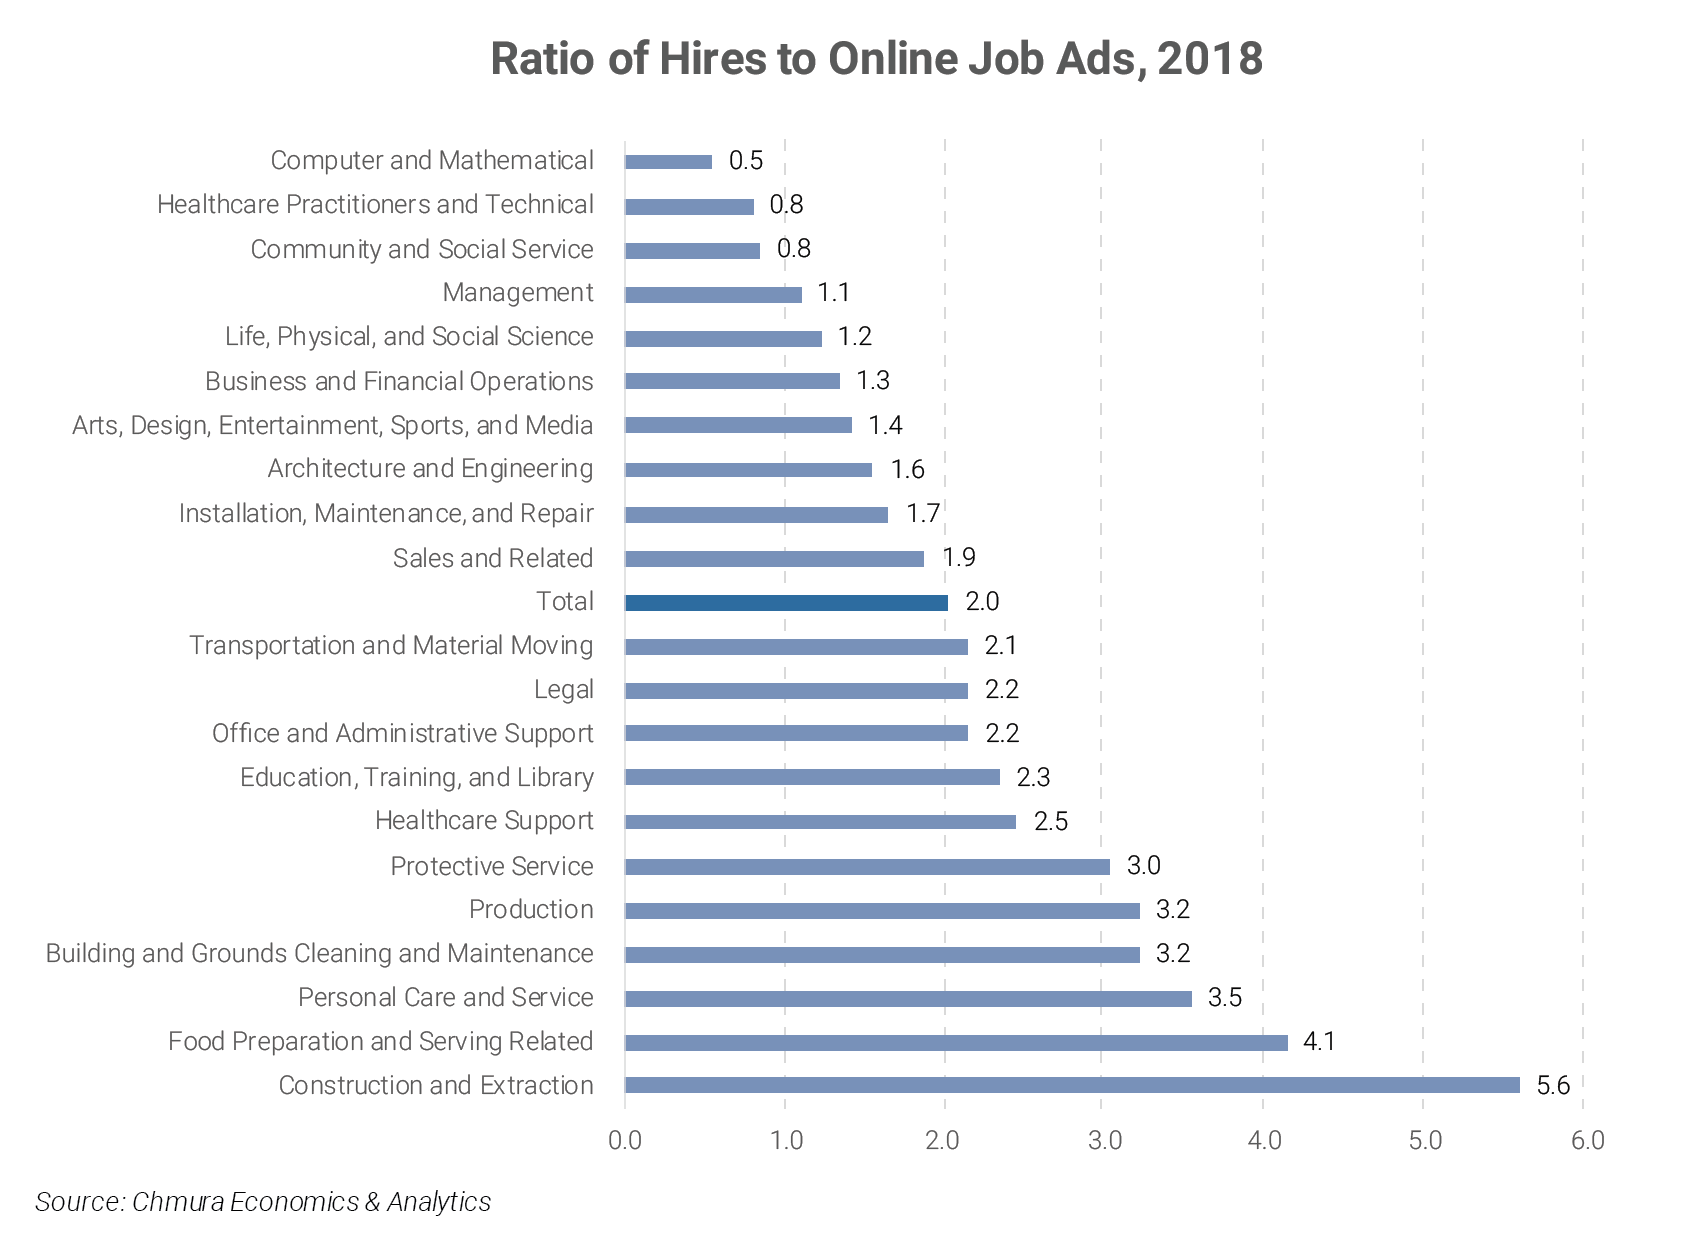
In 2018, there were 68.9 million hires in the United States per JOLTS.[2] This compares to 34.0 million online ads over the same period per JobsEQ.[3] Thus, there exists on average approximately one job ad for every two hires.
This ratio, however, varies by occupation group. The table below[4] shows this variation, indicating the volume of hires compared to the volume of online job ads.

On one extreme, the number of hires can exceed the number of online job ads by a wide margin. This occurs for occupations such as those in construction where job openings are simply not posted online as commonly as for other occupations.
The practice of using a single ad for multiple hires also contributes to increasing the number of hires per ad. This is common for food service occupations. A restaurant may put up a single ad for the purpose of multiple hires—sometimes leaving the same ad up for a long period of time.
On the other extreme we find the computer occupations.[5] The fact that the number of ads exceeds the volume of hires for this group is consistent with the known difficulty for filling these jobs. Having a low ratio of hires to ads can be influenced by several factors, such as ads being placed and frequently going unfilled, or employers needing to place several versions of an ad before getting a hire.
Technical Note
For comparing hires to job ads, the number of hires from JOLTS needed to be expressed in terms of occupations. JOLTS, however, does not report occupation data. Thus for this analysis, hires by occupation were estimated by adjusting JOLTS industry-level data for their occupation mix and taking into account occupational separations as well as job growth rates of occupations that occurred in 2018.[6] A much simpler and more rudimentary approach would have been to compare ad volume directly to employment; such an approach yielded results that were broadly aligned (R-squared value of 0.70) with the fuller analysis shown here.
[1] Also known as: Real-Time Labor Market Information (LMI).
[2] JOLTS stands for the Job Openings and Labor Turnover Survey: https://www.bls.gov/news.release/archives/jolts_03152019.htm
[3] JobsEQ contains the Real-Time Intelligence (RTI) data set, built with deduplicated ads captured from over 25,000 websites and updated daily. The set of online job ads used in this analysis includes job postings from staffing agencies. However, the relative volume of unique ads contributed by staffing firms is low and removing such ads would not materially affect the results.
[4] The occupation groups in this table correspond to 2-digit SOC groupings. The “farming, fishing, and forestry” group is omitted from this chart due to insufficient data, as the JOLTS survey is compiled from a sample of nonfarm establishments. An adjustment to these ratios were made to account for this industry exclusion.
[5] Technically, the computer and mathematical occupations group, though the computer occupations account for over 95% of employment in this category.
[6] Growth rates, separations, as well as industry/occupation mix data were all provided by JobsEQ, Chmura’s regional LMI software and database platform that aggregates and builds upon source data from the Bureau of Labor Statistics, the U.S. Census Bureau, and other agencies.