.png)
There are multiple sources for occupation jobs data. Some of these data sets may seem to contradict each other. In this article, we look at examples of this and the reasons behind it.

OES and ACS
We start with two examples of employment data for California. As shown in the below table, the first data set is from the Bureau of Labor Statistics (BLS), specifically from their Occupation Employment Statistics (OES) program. The second is from the US Census Bureau through the American Community Survey (ACS). Both sets are data for 2017.[1]
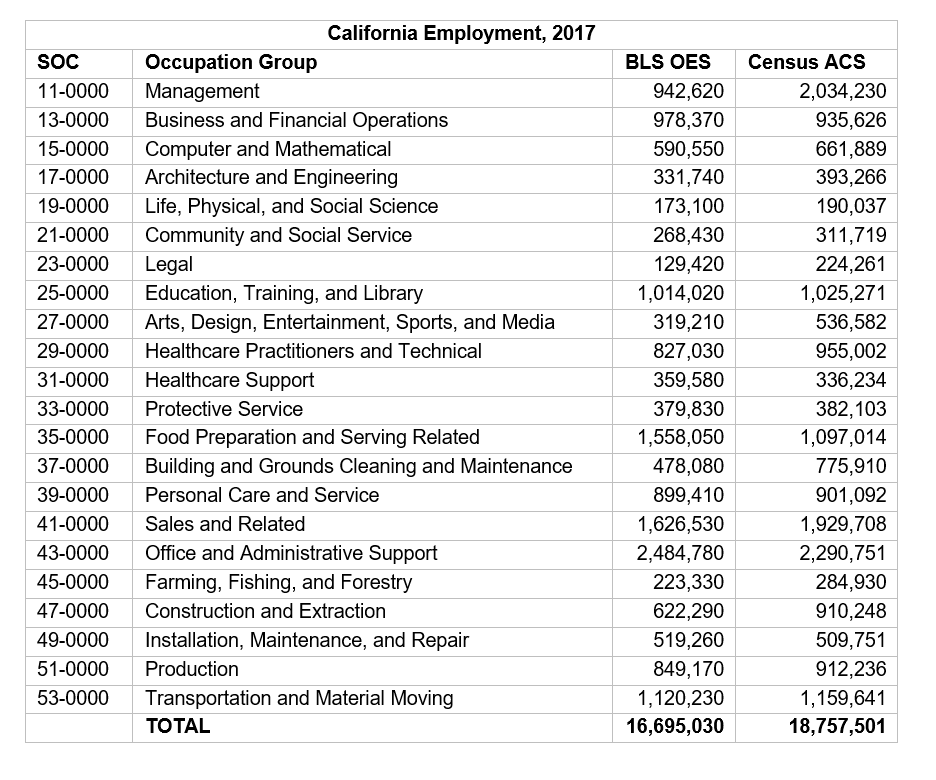
The numbers do not match exactly, which is not a surprise. Both sources also publish uncertainty measurements due to sample error. For example, in the Protective Service group, the Census provides a margin of error of 12,656 jobs and the BLS discloses a relative standard error of 1.3% for their estimate. Since the two sources only differ by 2,273 jobs, this uncertainty is more than enough to explain the difference between the two. However, while uncertainty can be used to explain this difference, it is not nearly enough to explain the much larger discrepancies in most other occupation groups.
What else is going on? One factor is that the BLS data are describing jobs at the place of work (jobs in California) while the Census data is based upon place of residence (jobs of people who live in California). Since some Californians work outside their state and since some workers in the state live outside of it, this is another reason for differences. This is a small factor in this case, though, as only about 0.5% of the California employed population work outside the state.[2]
A larger discrepancy can be seen by comparing the totals—the Census data shows over 18.7 million workers compared to just under 17.0 million per the BLS. This is largely driven by a difference in scope. The BLS data does not include certain industries (much of agriculture for example) and also does not include self-employment. Adjusting for the scope difference can help bring some numbers closer together; for example, the difference of about 288,000 jobs in construction and extraction can be narrowed but not completely closed when adding in the approximately 105,000 self-employed workers in this occupation group.[3]
Nevertheless, even with all these adjustments, discrepancies remain, including a few really large ones. The Census has management employment at over 2.0 million while the BLS data is under 943,000. Does this mean there are over a million self-employed workers in California who belong in the management category? We can plausibly make that argument: that self-employed workers, since they are managing their own businesses, are often best categorized into this occupation group. However, if we place most of our self-employed workers there, there are fewer left over to fill in gaps we see in other occupation groups.
Moreover, we are also left with cases where the BLS jobs data are higher, and thus the self-employed in the ACS data cannot explain the difference. The most notable example is in the food preparation and serving related occupation group where the BLS job estimate of over 1.5 million far exceeds the Census estimate of less than 1.1 million. This example forces us to get into the details of the individual surveys to understand what can be behind this.
In both the OES and ACS survey instruments, respondents are asked to describe occupations with a title and a short description—but with important differences. First is the respondent. The ACS surveys are completed by individuals about themselves,[4] individuals who likely rarely fill out such information and can be biased in how they choose to describe their own job duties.[5] The OES response forms are more likely to be filled out by personnel professionals, people more accustomed to providing such information and who are following more detailed instructions from the BLS on how to report certain distinctions, such as how to categorize individuals who perform supervisory duties but only a fraction of the time.[6]
Compounding those differences, a key point is that the job descriptions are necessarily “short,” perhaps a single phrase or sentence. That is not a lot of information with which to make nuanced classifications. For example, consider the occupation SOC 35-1012, “first-line supervisors of food preparation and serving workers,” versus SOC 11-9051, “food service managers.” Judging the distinction between these two occupations based on just one sentence of description can be very difficult. Given what they have to work with, it is not surprising that these two surveys with different samples and collection processes can produce different results.

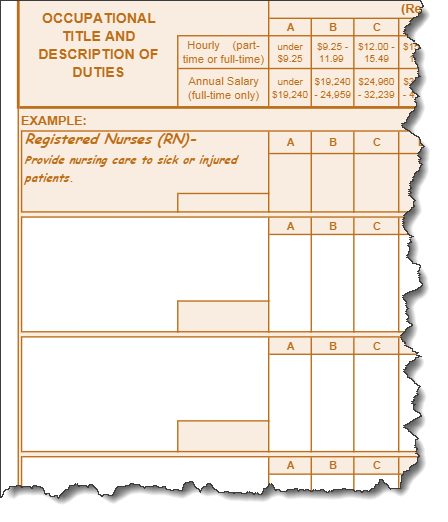
Above: entry boxes for occupation information within the ACS (left) and OES (right) survey instruments.
Traditional versus Nontraditional LMI
To further illustrate this point, consider another occupation dataset, Chmura’s Real-Time Intelligence (RTI) data which describes occupation job openings in online job ads. Data from online job ads is sometimes referred to as Nontraditional Labor Market Information (LMI) as compared to Traditional LMI which is based upon government-produced statistics.
Online job ad volume will not correlate exactly with employment volume or even the number of hires, something described here. Beyond that, however, it stands to reason that ad volume will have at least some correspondence with employment. There are some cases, however, that are very different.
A major underlying driver of these differences is the source information; namely, the job descriptions in online ads are typically much more lengthy than a mere one sentence found in the surveys. Job duties in online ads are often spelled out in great detail and accompanied by other information such as requirements for skills, experience, and education. Because of this greater detail available to classify jobs, matching advertised jobs to SOC[7] codes is a different process than categorizing jobs in either in the OES or ACS surveys.
An example of very clear differences in results can be seen in some of the “all other” occupations, the “catch-all” categories included in the detailed SOC codes to capture jobs that do not fit into more specific occupations. The 2018 OES survey, for example, classified 106,590 national jobs into “education, training, and library workers, all other” plus 18,570 into “cooks, all other.” The 2018 RTI data set, however, had zero jobs in either of these occupations, being able to use the more specific ad information to confidently place jobs into more specific categories rather than these generic groupings.
Imagine this scenario playing out across the process of categorizing any job. Even though the BLS, the Census, and Chmura (in the case of RTI) are using the same occupational taxonomy and definitions, simply having different information available is going to result in disparate results across the board. Results will certainly be comparable, but there will be important differences as well.
What Now?
The bottom line is to understand that there is a degree of uncertainty that accompanies occupation data and that this uncertainty can be much larger than the simple sampling error that may be disclosed with certain data sets. Moreover, data sets may have different scopes that can yield large differences in the snapshots they present. Finally, professionals working with these data can exercise discretion by being mindful of occupations that are similar or that can be easily confused with one another—essentially casting a wider net in examination of occupation data to account for the characteristics of the underlying source data.
Interested in understanding data? Check out our blog on How JobsEQ's Preliminary Estimates Keep You On Top of Labor Market Shifts.
[1] Though nominally for the same year, the time period of data collection for these two surveys isn’t the same. The OES survey uses a three-year sample for data collection and the ACS data cited here are based on a one-year sample.
[2] Commuting data per the 2017 Census American Community Survey.
[3] Construction self-employment data for 2017 per JobsEQ and is based upon persons whose primary income is being earned through self-employment.
[4] Technically, completed by individuals about themselves as well as about other workers in their household.
[5] Yet another difference is which job to choose. Many people have more than one job, be they multiple wage-and-salary positions, self-employment jobs, or combinations of both. An individual has to choose one job to disclose in the ACS survey. The OES survey in contrast, collects jobs from the employers, thus a person with multiple part-time jobs can have all those jobs captured within the OES data.
[6] See: https://www.bls.gov/respondents/oes/pdf/forms/uuuuuu_fillable.pdf.
[7] SOC stands for the Standard Occupational Classification. This system spans from 23 two-digit codes (“major groups”) to over 800 six-digit codes (“detailed occupations”).