.png)
According to data released in the U.S. Census Bureau’s 2015 Income and Poverty in the United States report, median household income jumped 5.2% in real terms last year, the largest increase since the Census Bureau began recording such data in 1967.[1] Despite the healthy jump in median household income last year, however, it still remains slightly below where it stood in 2007, the beginning of the Great Recession.
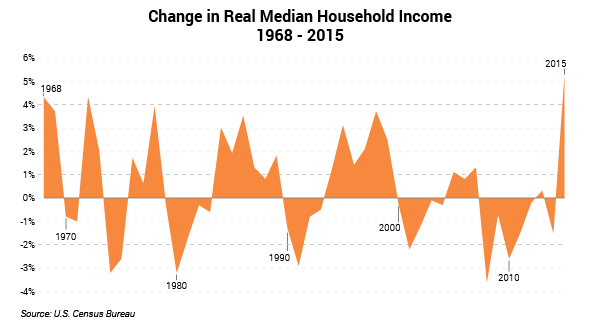
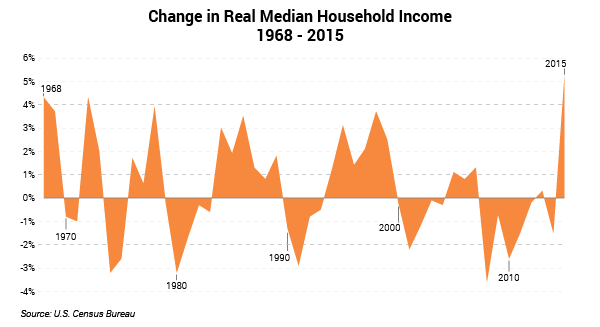
Source: U.S. Census Bureau
Note: Income questions were redesigned in 2014. 2013 data consisted of two subsamples—one which received the redesigned income questions and one which did not. The change in 2014 is calculated using the 2013 subsample which received the redesigned questions while the change in 2013 is calculated using the 2013 subsample which did not receive the redesigned questions.
The 5.2% gain in real median household income last year was driven by increases in both median income and the number of workers. The number of full-time, year-round male and female workers climbed by 1.4 million and 1.0 million, respectively, in 2015; real median earnings rose 1.5% and 2.7%, respectively, in 2015 for male and female full-time, year-round workers.
Hispanic-origin households experienced the largest increase in real median income last year at 6.1% compared with increases of 4.4% for non-Hispanic White households, 4.1% for Black households, and 3.7% for Asian households.[2] 2015 median income was highest for Asian households ($77,166) followed by non-Hispanic White households ($62,950), Hispanic households ($45,148), and finally Black households ($36,898).
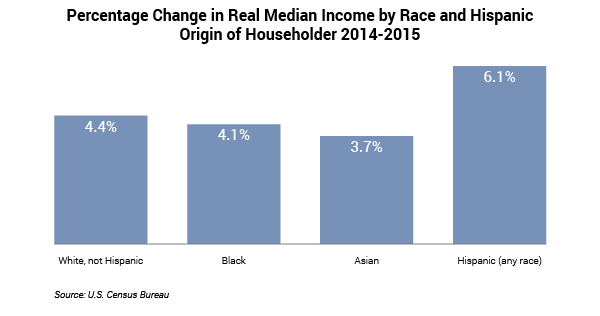
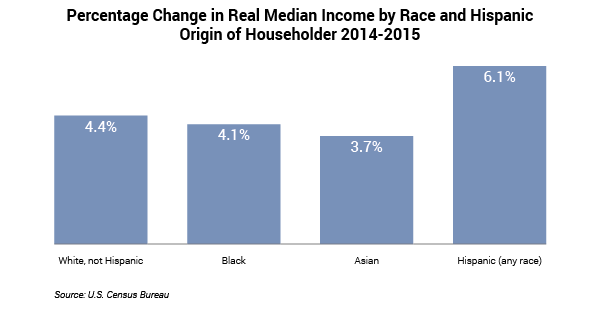
Source: U.S. Census Bureau
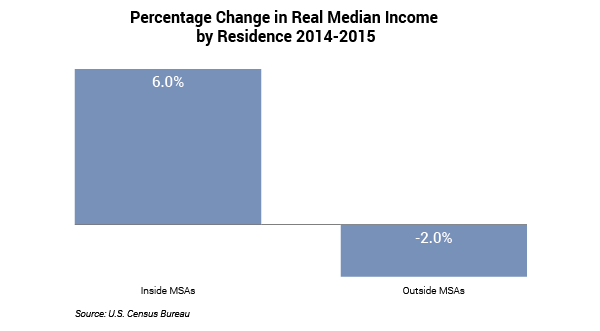
Median income for households living in Metropolitan Statistical Areas (MSAs) climbed 6.0% from 2014 to 2015 compared with a 2.0% drop in median income for households living outside MSAs.[3],[4] Median income for households living inside MSAs was $59,258 in 2015 compared with $44,657 for households living outside MSAs.

Source: U.S. Census Bureau
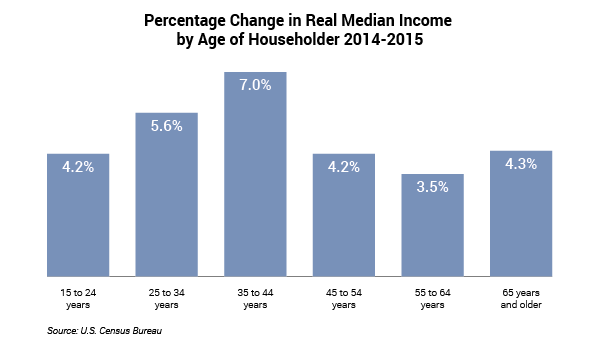
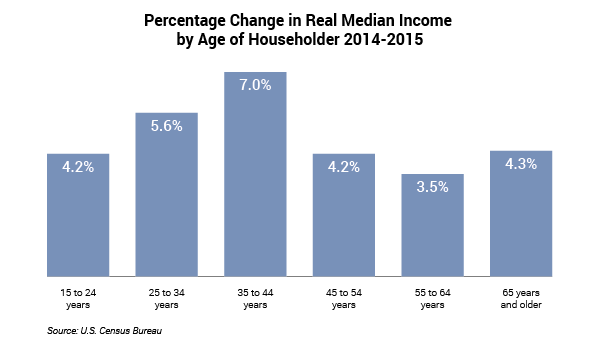
By age cohort, households maintained by householders aged 35 to 44 experienced the largest gain in median income last year at 7.0%. Householders aged 25 to 34 experienced the next largest increase in median income at 5.6% followed by those 65 and older at 4.3%. Median household income for householders aged 45 to 54 and 15 to 24 increased 4.2% last year while householders 55 to 64 saw the smallest increase in median income from 2014 to 2015 at 3.5%. All changes in median household income except for householders aged 15 to 24 were statistically significant.
Households maintained by householders aged 45 to 54 ($73,857) and 35 to 44 ($71,417) had the highest median income last year while those maintained by householders age 15 to 24 ($36,108) and 65 years and older ($38,515) had the lowest median income.
Source: U.S. Census Bureau
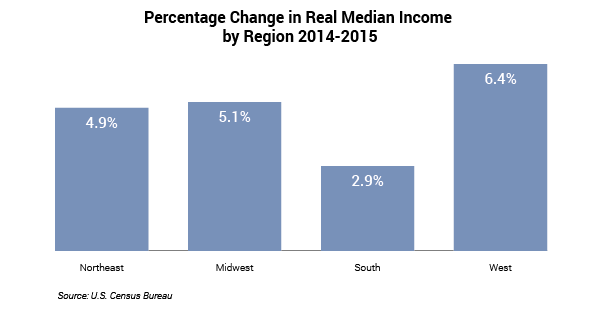
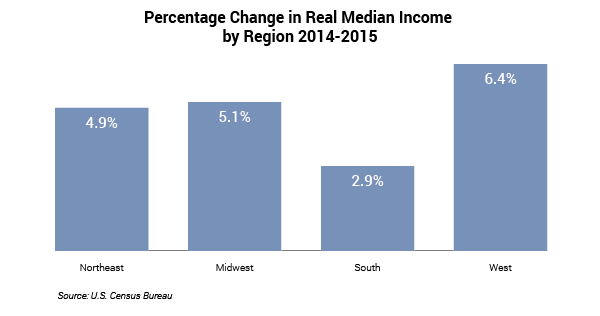
Median income rose 6.4% for households in the West, 5.1% in the Midwest, 4.9% in the Northeast, and 2.9% in the South from 2014 to 2015.[5] In 2015, median household income was highest in the Northeast ($62,182) followed by the West ($61,442), the Midwest ($57,082), and finally the South ($51,174).
Source: U.S. Census Bureau
[1] Household income includes the income of the householder and all other individuals in the house who are at least 15 years of age, regardless of whether or not they are related to the householder. A household can consist of only one person.
[2] The 2014 to 2015 percentage change was statistically significant for all groups but Asian households.
[3] The change in median income was statistically significant for households within MSAs but was not for households outside MSAs.
[4] Approximately 86% of the U.S. population lives in metropolitan areas.
[5] The percentage change was statistically significant for all regions.