.png)
The map below shows defense contract spending by MSA from FY 2000 to 2015. The circles are proportional (i.e., they are scaled to the value of defense contracts in that MSA). Beginning in FY 2001, the color of each circle indicates whether defense contract spending in the MSA declined (red) or increased (green) from a year earlier. The map can be manually advanced or will advance automatically when you click on “Play.”
The table below the map shows DoD contract spending in the top 100 MSAs and updates each time a new fiscal year is selected. The map informs the following question categories:
- Which MSAs are the largest recipients of DoD contract spending?
- In which regions is DoD contract spending concentrated?
- In which MSAs is DoD contract spending increasing/decreasing from the prior year?
For example, the map shows DoD contract spending surges in the Washington, D.C. MSA from FY 2000 to FY 2010 when spending climbed from $8.0 billion to $39.5 billion before declining beginning in FY 2011.
To learn more about Chmura’s expertise and research regarding defense spending and supply chain mapping, contact us here.
-
DoD Contract
Spending
by MSA -
FY2000
| Rank | MSA | Spending in FY2000 (millions) |
|---|---|---|
| 1 | Washington-Arlington-Alexandria, DC-VA-MD-WV MSA | $8,044 |
| 2 | Los Angeles-Long Beach-Anaheim, CA MSA | $3,707 |
| 3 | Boston-Cambridge-Newton, MA-NH MSA | $2,020 |
| 4 | Dallas-Fort Worth-Arlington, TX MSA | $1,938 |
| 5 | Virginia Beach-Norfolk-Newport News, VA-NC MSA | $1,687 |
| 6 | New York-Newark-Jersey City, NY-NJ-PA MSA | $1,618 |
| 7 | Huntsville, AL MSA | $1,568 |
| 8 | San Jose-Sunnyvale-Santa Clara, CA MSA | $1,414 |
| 9 | Philadelphia-Camden-Wilmington, PA-NJ-DE-MD MSA | $1,410 |
| 10 | St. Louis, MO-IL MSA | $1,296 |
| 11 | San Diego-Carlsbad, CA MSA | $1,285 |
| 12 | Phoenix-Mesa-Scottsdale, AZ MSA | $1,037 |
| 13 | Atlanta-Sandy Springs-Roswell, GA MSA | $1,023 |
| 14 | Baltimore-Columbia-Towson, MD MSA | $899 |
| 15 | Houston-The Woodlands-Sugar Land, TX MSA | $728 |
| 16 | Tucson, AZ MSA | $722 |
| 17 | Orlando-Kissimmee-Sanford, FL MSA | $716 |
| 18 | San Antonio-New Braunfels, TX MSA | $687 |
| 19 | Cincinnati, OH-KY-IN MSA | $675 |
| 20 | Minneapolis-St. Paul-Bloomington, MN-WI MSA | $637 |
| 21 | Sacramento--Roseville--Arden-Arcade, CA MSA | $598 |
| 22 | Indianapolis-Carmel-Anderson, IN MSA | $573 |
| 23 | Amarillo, TX MSA | $555 |
| 24 | Miami-Fort Lauderdale-West Palm Beach, FL MSA | $549 |
| 25 | Seattle-Tacoma-Bellevue, WA MSA | $530 |
| 26 | Chicago-Naperville-Elgin, IL-IN-WI MSA | $464 |
| 27 | Dayton, OH MSA | $455 |
| 28 | Denver-Aurora-Lakewood, CO MSA | $431 |
| 29 | Bridgeport-Stamford-Norwalk, CT MSA | $426 |
| 30 | New Orleans-Metairie, LA MSA | $405 |
| 31 | San Francisco-Oakland-Hayward, CA MSA | $377 |
| 32 | Detroit-Warren-Dearborn, MI MSA | $365 |
| 33 | Riverside-San Bernardino-Ontario, CA MSA | $347 |
| 34 | Palm Bay-Melbourne-Titusville, FL MSA | $345 |
| 35 | Colorado Springs, CO MSA | $322 |
| 36 | Norwich-New London, CT MSA | $322 |
| 37 | Richmond, VA MSA | $320 |
| 38 | Oklahoma City, OK MSA | $312 |
| 39 | Charleston-North Charleston, SC MSA | $302 |
| 40 | Ogden-Clearfield, UT MSA | $284 |
| 41 | Providence-Warwick, RI-MA MSA | $280 |
| 42 | Austin-Round Rock, TX MSA | $280 |
| 43 | California-Lexington Park, MD MSA | $275 |
| 44 | Binghamton, NY MSA | $271 |
| 45 | Louisville/Jefferson County, KY-IN MSA | $270 |
| 46 | Tampa-St. Petersburg-Clearwater, FL MSA | $257 |
| 47 | Columbus, OH MSA | $248 |
| 48 | South Bend-Mishawaka, IN-MI MSA | $230 |
| 49 | Oshkosh-Neenah, WI MSA | $218 |
| 50 | Bremerton-Silverdale, WA MSA | $213 |
| 51 | Pittsburgh, PA MSA | $210 |
| 52 | Jacksonville, FL MSA | $198 |
| 53 | Cedar Rapids, IA MSA | $185 |
| 54 | Albuquerque, NM MSA | $178 |
| 55 | Albany-Schenectady-Troy, NY MSA | $172 |
| 56 | Wichita, KS MSA | $167 |
| 57 | Portland-South Portland, ME MSA | $158 |
| 58 | Montgomery, AL MSA | $143 |
| 59 | Manchester-Nashua, NH MSA | $142 |
| 60 | Jackson, MS MSA | $139 |
| 61 | Syracuse, NY MSA | $137 |
| 62 | Gulfport-Biloxi-Pascagoula, MS MSA | $134 |
| 63 | Corpus Christi, TX MSA | $133 |
| 64 | Oxnard-Thousand Oaks-Ventura, CA MSA | $130 |
| 65 | Santa Maria-Santa Barbara, CA MSA | $129 |
| 66 | Salt Lake City, UT MSA | $127 |
| 67 | Fort Wayne, IN MSA | $119 |
| 68 | Allentown-Bethlehem-Easton, PA-NJ MSA | $118 |
| 69 | Akron, OH MSA | $118 |
| 70 | Urban Honolulu, HI MSA | $117 |
| 71 | York-Hanover, PA MSA | $116 |
| 72 | Harrisburg-Carlisle, PA MSA | $115 |
| 73 | Baton Rouge, LA MSA | $114 |
| 74 | Portland-Vancouver-Hillsboro, OR-WA MSA | $109 |
| 75 | Pittsfield, MA MSA | $102 |
| 76 | Cleveland-Elyria, OH MSA | $101 |
| 77 | Waco, TX MSA | $99 |
| 78 | Beaumont-Port Arthur, TX MSA | $99 |
| 79 | Crestview-Fort Walton Beach-Destin, FL MSA | $94 |
| 80 | Greensboro-High Point, NC MSA | $92 |
| 81 | Anchorage, AK MSA | $92 |
| 82 | Lexington-Fayette, KY MSA | $91 |
| 83 | Pensacola-Ferry Pass-Brent, FL MSA | $88 |
| 84 | Salisbury, MD-DE MSA | $88 |
| 85 | Mobile, AL MSA | $86 |
| 86 | Hartford-West Hartford-East Hartford, CT MSA | $84 |
| 87 | Buffalo-Cheektowaga-Niagara Falls, NY MSA | $84 |
| 88 | Rochester, NY MSA | $79 |
| 89 | Milwaukee-Waukesha-West Allis, WI MSA | $79 |
| 90 | Burlington-South Burlington, VT MSA | $77 |
| 91 | Charlotte-Concord-Gastonia, NC-SC MSA | $75 |
| 92 | Kansas City, MO-KS MSA | $72 |
| 93 | Sioux City, IA-NE-SD MSA | $70 |
| 94 | Grand Rapids-Wyoming, MI MSA | $69 |
| 95 | Evansville, IN-KY MSA | $66 |
| 96 | Savannah, GA MSA | $66 |
| 97 | Memphis, TN-MS-AR MSA | $66 |
| 98 | Johnstown, PA MSA | $61 |
| 99 | Greenville-Anderson-Mauldin, SC MSA | $61 |
| 100 | Pine Bluff, AR MSA | $60 |
| Source: Chmura Economics & Analytics | ||
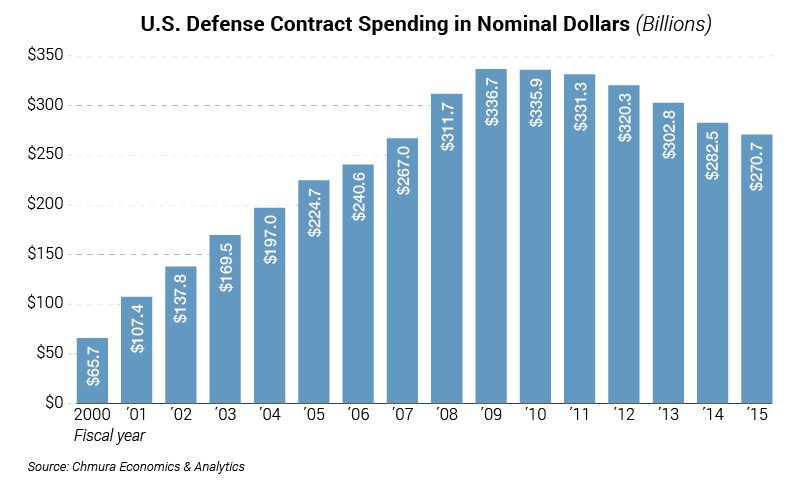
Department of Defense (DoD) contract spending grew at a strong pace in the first decade of the 21st century, but has been in decline since fiscal year (FY) 2010 based on Chmura’s proprietary FedSpendTOP data.[1],[2] Spending peaked at $336.7 billion in FY 2009 and has since fallen by 19.6% to $270.7 billion in FY 2015.[3] Contributing to the decline was the Budget Control Act of 2011 (sequestration took effect in 2013) and the drawdown of U.S. forces in both Iraq and Afghanistan.

The impact of defense contract spending cuts has been and will continue to be uneven across regions and states. This analysis shows which metropolitan statistical areas (MSAs) have been most impacted by defense contract spending cuts. At the aggregate level, some of the largest MSAs have seen the most dramatic cuts from fiscal year 2009—the peak nationally of DoD contract spending—to fiscal year 2015, which is the most recent fiscal year of data available. On a per capita basis, however, the 10 largest declines in defense contract spending were experienced in MSAs with populations of less than 500,000.
While the Washington, D.C. MSA—home to the headquarters of several large defense contractors including Lockheed Martin, General Dynamics, and Northrop Grumman—experienced the largest drop in defense contract spending ($6.5 billion) from FY 2009 to 2015, on a per capita basis the decline was only $1,072; this was the 31st largest per capita decline in defense contract spending among the MSAs. Defense contract spending fell $2.3 billion in the New York metropolitan area from FY 2009 to 2015; this, however, only represented a loss of $116 on a per capita basis.
In contrast, a $2.3 billion decline in the Oshkosh MSA represented a loss of $13,378 per person, the largest per capita decline among all MSAs over this period. The Oshkosh MSA is home to the Oshkosh Corporation, a military vehicle manufacturer, which has reduced its workforce in response to declining defense contract spending.
From FY 2009 to 2015, defense contract spending decreased by $301.9 million or $2,891 per capita in the Lima, Ohio MSA; the Joint Systems Manufacturing Center, a government-owned, contractor-operated tank production facility in Lima operated by General Dynamics Land Systems, has experienced a production hiatus as the Army shifts production from the M1A2 Abrams fleet to the M1A3.
The labor market impact of defense contract spending cuts can vary widely depending on the type and nature of the defense contract spending. Every industry in the area will have a different economic impact based on the size of its local supply chain and the spending spillover from its directly employed workers. It stands to reason, however, that these spending cuts, as steep as they are, can be a driving force to upset labor markets in many of the nation’s MSAs, both large and small.
| MSA | Total Defense Contract Cuts FY 2009 to 2015 |
|---|---|
| Washington-Arlington-Alexandria, DC-VA-MD-WV MSA | -$6,534,964,135 |
| Phoenix-Mesa-Scottsdale, AZ MSA | -$4,540,569,745 |
| Los Angeles-Long Beach-Anaheim, CA MSA | -$4,334,692,207 |
| Detroit-Warren-Dearborn, MI MSA | -$2,930,431,025 |
| New York-Newark-Jersey City, NY-NJ-PA MSA | -$2,338,177,154 |
| Oshkosh-Neenah, WI MSA | -$2,268,233,215 |
| Chicago-Naperville-Elgin, IL-IN-WI MSA | -$2,238,919,430 |
| New Orleans-Metairie, LA MSA | -$2,159,563,955 |
| York-Hanover, PA MSA | -$2,016,694,563 |
| Boston-Cambridge-Newton, MA-NH MSA | -$1,779,815,870 |
| Louisville/Jefferson County, KY-IN MSA | -$1,717,377,395 |
| Cincinnati, OH-KY-IN MSA | -$1,664,995,187 |
| Memphis, TN-MS-AR MSA | -$1,620,314,173 |
| Houston-The Woodlands-Sugar Land, TX MSA | -$1,488,712,685 |
| San Antonio-New Braunfels, TX MSA | -$1,391,688,781 |
| Hartford-West Hartford-East Hartford, CT MSA | -$1,359,347,332 |
| South Bend-Mishawaka, IN-MI MSA | -$1,140,970,964 |
| El Paso, TX MSA | -$1,112,974,753 |
| Bellingham, WA MSA | -$966,597,640 |
| Charleston-North Charleston, SC MSA | -$910,442,557 |
| MSA | Total Defense Contract Cuts FY 2009 to 2015 | $ Cut per Capita |
|---|---|---|
| Oshkosh-Neenah, WI MSA | -$2,268,233,215 | -$13,378 |
| York-Hanover, PA MSA | -$2,016,694,563 | -$4,554 |
| Bellingham, WA MSA | -$966,597,640 | -$4,553 |
| South Bend-Mishawaka, IN-MI MSA | -$1,140,970,964 | -$3,564 |
| Lima, OH MSA | -$301,908,063 | -$2,891 |
| Crestview-Fort Walton Beach-Destin, FL MSA | -$725,869,109 | -$2,769 |
| Watertown-Fort Drum, NY MSA | -$300,052,222 | -$2,551 |
| Anniston-Oxford-Jacksonville, AL MSA | -$287,665,595 | -$2,488 |
| Fort Wayne, IN MSA | -$852,247,912 | -$1,983 |
| California-Lexington Park, MD MSA | -$213,631,915 | -$1,917 |
| New Orleans-Metairie, LA MSA | -$2,159,563,955 | -$1,710 |
| Anchorage, AK MSA | -$591,040,245 | -$1,478 |
| Sioux City, IA-NE-SD MSA | -$248,450,379 | -$1,470 |
| Roanoke, VA MSA | -$450,132,483 | -$1,431 |
| Louisville/Jefferson County, KY-IN MSA | -$1,717,377,395 | -$1,343 |
| El Paso, TX MSA | -$1,112,974,753 | -$1,327 |
| Binghamton, NY MSA | -$323,305,058 | -$1,314 |
| Columbus, GA-AL MSA | -$410,919,789 | -$1,310 |
| Bangor, ME MSA | -$192,447,838 | -$1,260 |
| Palm Bay-Melbourne-Titusville, FL MSA | -$713,521,119 | -$1,256 |
| MSA | Total Defense Contract Gains FY 2009 to 2015 |
|---|---|
| Minneapolis-St. Paul-Bloomington, MN-WI MSA | $2,003,699,292 |
| Seattle-Tacoma-Bellevue, WA MSA | $1,713,789,488 |
| Baltimore-Columbia-Towson, MD MSA | $1,054,626,982 |
| Bridgeport-Stamford-Norwalk, CT MSA | $803,582,514 |
| Pittsburgh, PA MSA | $803,508,009 |
| Norwich-New London, CT MSA | $777,377,637 |
| Mobile, AL MSA | $679,625,713 |
| Portland-South Portland, ME MSA | $575,384,923 |
| Amarillo, TX MSA | $513,600,860 |
| Philadelphia-Camden-Wilmington, PA-NJ-DE-MD MSA | $415,749,550 |
| MSA | Federal Contract Gains 2009 to 2015 | $ Gains Per Capita |
|---|---|---|
| Norwich-New London, CT MSA | $777,377,637 | $2,859 |
| Pittsfield, MA MSA | $301,455,515 | $2,358 |
| Amarillo, TX MSA | $513,600,860 | $1,960 |
| Mobile, AL MSA | $679,625,713 | $1,636 |
| Lynchburg, VA MSA | $326,223,707 | $1,255 |
| Portland-South Portland, ME MSA | $575,384,923 | $1,093 |
| Pine Bluff, AR MSA | $85,602,563 | $914 |
| Bridgeport-Stamford-Norwalk, CT MSA | $803,582,514 | $848 |
| Idaho Falls, ID MSA | $91,296,319 | $653 |
| Minneapolis-St. Paul-Bloomington, MN-WI MSA | $2,003,699,292 | $568 |
| Source: Chmura Economics & Analytics and U.S. Census Bureau Note: July 2015 population estimates used to calculate cuts and gains per capita. |
||
[1] The U.S. federal government’s fiscal year begins on October 1 of the previous calendar year and ends on September 30. For example, FY 2001 began October 1, 2000 and ended September 30, 2001.
[2] FedSpendTOP data are derived from USASpending.gov data but provide a more accurate picture of federal spending based on the time and place of performance when compared with published federal awards data. The data are adjusted for the length of the contract as well as for an associated subcontract’s place of performance (i.e., regional spending is based on place of performance with out-of-region awards subcontracted into the area added in and in region awards subcontracted out of the region subtracted out); FedSpendTOP data also include purchases by non-DoD agencies which end up in DoD products and have been corrected for errors identified during Chmura’s quality control process.
[3] In nominal dollars (i.e., not adjusted for inflation).