.png)
Growth in Science, Technology, Engineering, and Mathematics (STEM) jobs is expected to continue to outpace growth in non-STEM jobs over the next decade. The Bureau of Labor Statistics released new 10-year employment projections in December for 2014 to 2024. At the detailed occupation level, 603 out of 821 occupations are expected to grow over this period while employment in 198 occupations is projected to decline; 20 occupations are expected to see no growth or decline in employment over the next ten years. For STEM occupations, 8% are expected to decline over the next decade compared with 27% of non-STEM occupations.[1]
On average, STEM jobs pay a large premium over non-STEM jobs. Based on 2014 wages, STEM occupations paid an average of $85,200 compared with $45,100 for non-STEM occupations. While part of this wage gap is due to differences in educational attainment,[2] STEM employees with a bachelor’s degree or higher command higher average annual wages ($92,800) than non-STEM employees with at least a bachelor’s degree (average annual wages of $83,900).
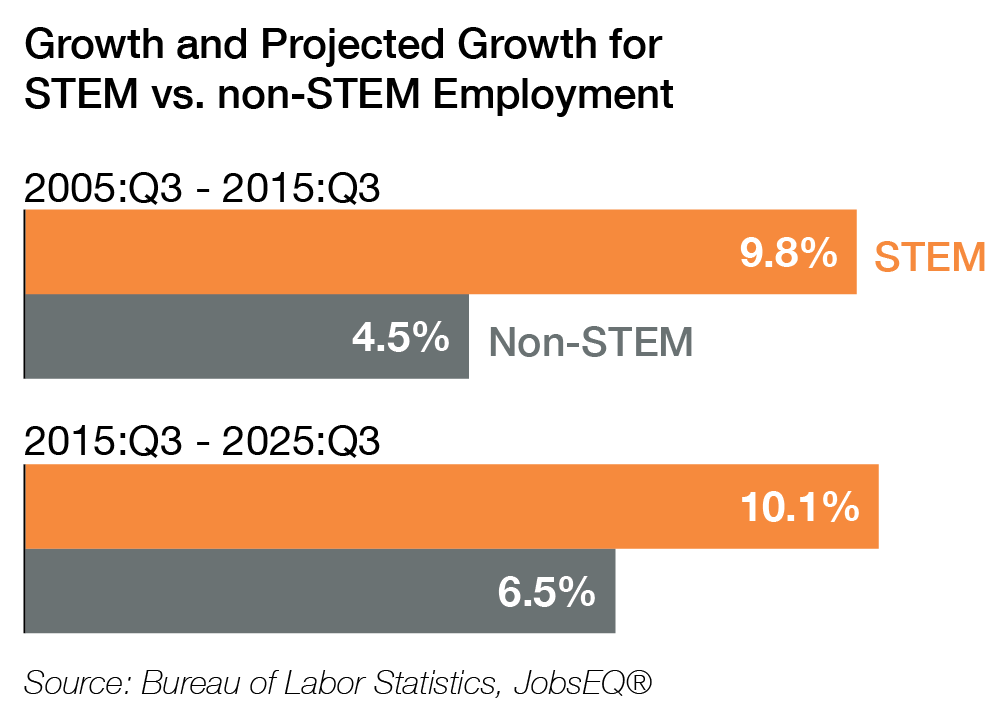
In addition to paying high wages, STEM jobs have grown faster than non-STEM jobs over the past decade and are expected to continue that trend over the next ten years. As of the third quarter of 2015, there were 9.2 million workers in STEM occupations in the United States, making up 6.1% of total employment in the nation.[3] From the third quarter of 2005 to the third quarter of 2015, STEM employment increased 9.8%, twice as fast as the 4.5% increase experienced in non-STEM employment. Employment in STEM occupations is projected to increase 10.1% from the third quarter of 2015 through the third quarter of 2025 while non-STEM employment is forecast to rise 6.5%.

All STEM jobs are not expected to grow equally, however. At the major occupation group level, projected employment growth for STEM occupations over the next decade ranges from 14.3% for computer and mathematical occupations down to 4.0% for architecture and engineering occupations (below the average expected growth in Non-STEM jobs). Not surprisingly, within major occupation groups projected employment growth for STEM occupations also varies by detailed occupation. In the computer and mathematical occupations group, for example, employment for mathematical technicians is expected to grow at a 0.3% annual average rate compared with 2.5% projected growth for web developers.
| SOC Major Group | Projected Growth Rate |
|---|---|
| Computer and Mathematical Occupations | 14.3% |
| Education, Training, and Library Occupations | 12.6% |
| Management Occupations | 10.9% |
| Life, Physical, and Social Science Occupations | 8.5% |
| Sales and Related Occupations | 8.2% |
| Architecture and Engineering Occupations | 4.0% |
| Source: BLS and JobsEQ® | |
[1] STEM occupations were identified based on the SOC Policy Committee recommendations to the Office of Management and Budget; health occupations were excluded. For more on defining STEM, see our related blog.
[2] Eighty-one percent of those employed in STEM occupations hold at least a bachelor’s degree compared with 25% of those employed in non-STEM occupations.
[3] Employment includes estimates for proprietors as well as railroad and religious employees that are not covered by unemployment insurance.