.png)
State-level gross domestic product (GDP) is now available by quarter. Previously, the U.S. Bureau of Economic Analysis (BEA) only provided state-level GDP on an annual basis. The agency’s news release explains “These new statistics provide a more complete picture of economic growth across states that can be used with other regional data to gain a better understanding of regional economies as they evolve from quarter to quarter.”
Below is a dashboard showing the quarterly annualized percent change in GDP by state from 2005Q2 through 2013Q4. Use the bar in the middle of the page to slide through time or select a specific quarter from the dropdown menu. You can hover over any state for more detailed information, and the percentage change for the United States is summarized in the bar chart below the map for comparison purposes. One note on interpretation: U.S. GDP by state excludes federal military and civilian activity located overseas (it cannot be attributed to a particular state), so a summation of quarterly GDP by state for the nation will differ somewhat from the GDP in the national income and product accounts (NIPAs).
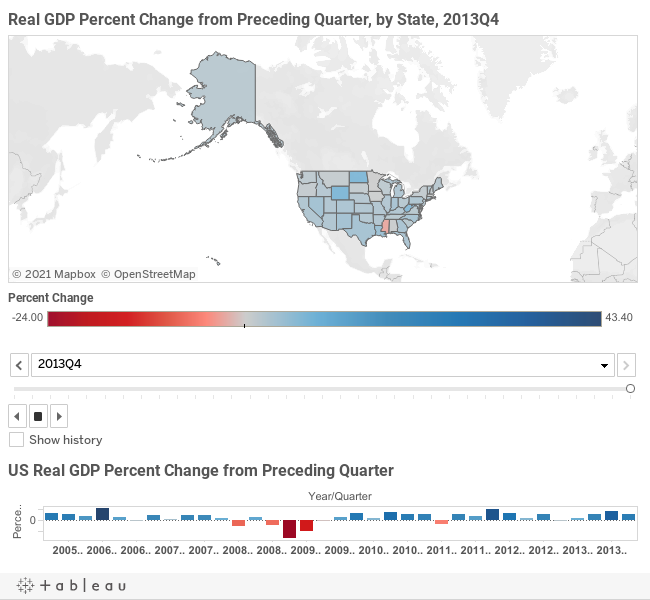
This format in the link above makes it easy to see, for example, that while GDP in the fourth quarter of 2013 increased or was unchanged over the quarter for the nation as well as in 49 states, it decreased 3.0% in Mississippi. More data are available from the BEA, including 21 industry sectors—check it out and let us know what you think.